What is technical analysis?
Many cryptocurrency traders use technical analysis to help them devise their trading strategies. This type of analysis looks at past movements in the cryptocurrency and financial markets in order to try and predict where they will move in the future.
Technical analysis is the process of using real-world historical data to predict future market movements. This involves studying past statistics of relevant cryptocurrencies, such as volume and price movements.
Technical analysis consists of observing historical price patterns and using analytical charting tools to identify the strengths and weaknesses of cryptocurrencies in order to make predictions about future price movements. Technical analysis is also used by traders who trade more traditional assets, such as stocks, commodities, currencies, futures, and forex. Let us dig deeper into some of the analyses that are involved in technical analysis.

Candlestick Charts
Candlestick charts are one of the most popular methods of technical analysis and are used to track the price movement of a cryptocurrency over time. They can help traders identify patterns in price movements.
A candlestick chart is composed of a series of candles, each representing the price movement of a cryptocurrency over a period of time. The candle body shows the opening and closing prices for that period, while the wicks illustrate the high and low prices reached during that time.
There are a number of different factors that traders can look at when analysing candlestick charts, including:

The length of the body
A long body indicates that the price movement for that period was significant, while a short body indicates that the price movement was insignificant.
The colour of the candle
A green candle indicates that the price closed higher than it opened, while a red candle indicates that the price closed lower than it opened.
The size of the wicks
The more extensive the wicks, the greater the range between the high and low prices reached during that period.
The location of the wicks
Wicks that are located at the top and bottom of the candlestick body indicate that the price reached new highs or lows for that period.
The pattern of the candlesticks
Candlestick patterns can be used to predict future price movements. Some common chart patterns include head and shoulders, inverted head and shoulders, triangles, and wedges.
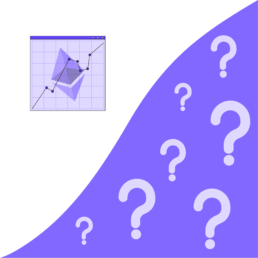
Trend Lines
Trend lines are another popular method of technical analysis. They are used to identify the direction of a cryptocurrency’s price movement and can be used to predict future price movements. There are three types of trend lines:

Upward and downward trend lines
Upward trend lines indicate that the price is trending upwards. Meanwhile, downward trend lines indicate that the price is trending downwards.
Sideway trend lines
Sideway trend lines indicate that the price has not moved significantly up or down.
Trend lines can be drawn by hand or using a charting tool. When drawing trend lines by hand, it is important to use a technique known as ‘joining the dots’. This involves connecting the points where the price has changed direction, in order to create a smooth line.
Depending on the analysis program you use, the process of drawing an accurate trend line will differ. However, in most cases, you can begin by placing the trend line at the candlestick’s lowest price. From your original starting point, extend the line so that it meets the next candlestick’s lowest point. Make sure to use the exact lows for both candles by making necessary adjustments. After doing this step correctly, you should be able to extend the line automatically going forward.

Support and resistance
As a trader, you will also want to be aware of support and resistance levels. Support levels are points where the price is likely to find support and resist moving lower. Resistance levels are points where the price is likely to find resistance and resist moving higher.
Support and resistance levels can be identified by drawing trend lines between successive lows (for support levels) or highs (for resistance levels). When the price reaches a support or resistance level, it is likely to bounce off that level and continue in the direction of the trend line.
Technical analysis is often used to find support or resistance levels in order to indicate the current trend. Stronger technical indicators of said trend occurs when the resistance level becomes a support level as well. Always keep in mind that just because a trend looks like it’s changing, doesn’t mean it actually is.
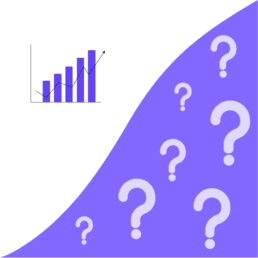
Trading Volumes
A cryptocurrency’s trading volume can clue you into the significance of a trend. Generally, high trading volume points to a sustained or growing trend worthy of your notice. On the other hand, weak trends with low volume are likely to fizzle out fast.
You can use this knowledge by checking the trading volume of a cryptocurrency if its price drops. Look for a low volume during the declines and higher volumes during the increases. This would indicate that the crypto is likely in a healthy trend with long-term growth potential. By contrast, if the volume during those declines goes up, then it’s likely that the upward trend will end soon. Volume can also give you similar information but in reverse in cases of downward trends.


Choosing Time Frames
You can use different time frames on your price chart when you do technical analysis. For example, some people set it to 15 minutes, hourly, four hours, or daily. The choice depends on what type of trader you are.
If you’re an intra-day or short-term trader who usually closes all positions within one day, then you should use shorter time frames on your charts. Common choices for this type of trader include five minutes, 15 minutes, and one hour. Using a longer time frame than this is typically not ideal.
Long-term traders maintain their positions for a much more extended duration, which might be weeks, months, or even years. Long-term cryptocurrency investors should focus on larger time periods like four-hour, daily, or weekly price charts when making decisions.
Summary
Technical analysis can give cryptocurrency traders insight into the past of crypto, facilitating future predictions. Most charting software has numerous technical analysis tools already built into it and you can supplement these with your own analysis. For the best results, always try to combine technical analysis with other fundamental analyses.
You should never only use technical analysis when trading cryptocurrencies because you would not get any information about news or events that could impact the coin's price. Technical analysis falls short when it comes to cryptocurrency trading because important things that can affect the price, like mining hash and regulations, are not accounted for.